8,460 Google Discover clicks in two weekends
Two Sunday spikes sent Planetary Design's coffee blog from zero Discover traffic to 8,460 clicks, lifted store sessions 63%, and more than doubled traffic to the product that answers the question those posts asked. Here is what it did to traffic, conversion and revenue, and what we would do with the next spike.
By SEOasis · Planetary Design, makers of the Airscape coffee canister · Search Console and GA4, Jul 1 to Aug 7, 2026
Discover clicks
Discover impressions
average click-through rate
store sessions
Two Sundays Did the Work
There was no Discover activity at all before Jul 17. Then two Sunday peaks, Jul 19 and Aug 2, delivered almost all of the 8,460 clicks, and each one faded back to near zero within a week.

Sunday, Jul 19
~1.7K clicks
in a single day
Sunday, Aug 2
~1.1K clicks
in a single day
In between
Near zero
within a week of each peak
Two Evergreen Coffee Posts Drove 87% of Clicks
Eight posts were served in Discover. Two broad, everyday coffee questions took almost all of the traffic. The niche camping and cleaning guides barely registered.
| Post | Clicks | Impressions | CTR |
|---|---|---|---|
| Pour-over vs. French press: which brews better | 3,966 | 84,364 | 4.7% |
| How long does coffee stay fresh | 3,417 | 79,237 | 4.3% |
| How to store coffee beans properly | 659 | 12,346 | 5.3% |
| How to store coffee beans: long-term guide | 72 | 1,714 | 4.2% |
| How to keep drinks cold while camping | 59 | 2,673 | 2.2% |
| How to brew coffee while camping | 10 | 334 | 3.0% |
| How to clean a pour-over coffee maker | 9 | 525 | 1.7% |
| Pour-over water temperature guide | 5 | 141 | 3.5% |
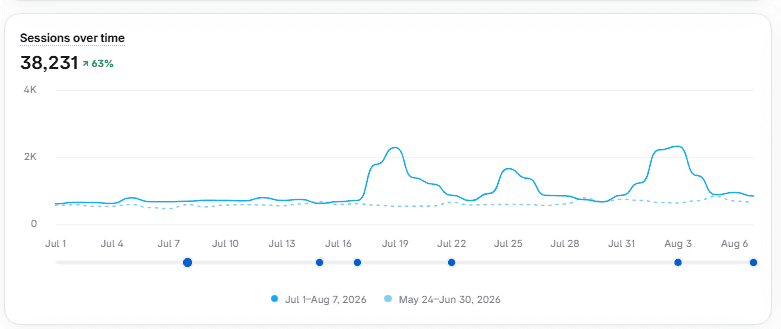
Store Sessions Jumped 63% on the Same Two Weekends
38,231 sessions from Jul 1 to Aug 7, up 63% on May 24 to Jun 30. The baseline sat near 650 sessions a day, with peaks near 2.3K around Jul 19 and Aug 3.
Organic Traffic Grew. Conversion Rate Dipped.
The GA4 organic channel for Jul 1 to Aug 7 against the prior period. Sessions and new users were up by half. Purchases and conversion rate went the other way. Revenue still grew, carried by a higher average order value.
Organic sessions
16,095
+47.8% vs. prior period
New users
12,239
+49.5% vs. prior period
Purchases
305
−9.5% vs. prior period
Conversion rate
1.89%
−38.8% vs. prior period
Average order value
$68.59
+24.4% vs. prior period
Organic revenue
$20,919
+12.6% vs. prior period, +116.5% YoY
Source: GA4 organic channel, Jul 1 to Aug 7, 2026 vs. the prior period. Organic figures cover the whole channel, not Discover alone.
sessions on the Airscape Kilo Coffee Canister page
+143% vs. May 24 to Jun 30
Coffee Storage Content Met a Coffee Storage Product
The two biggest Discover posts answer how to keep coffee fresh and how to store it. The Airscape canister is the product that solves that problem, and its page traffic more than doubled on the same weekends.
The Audience Went Global
Discover is served worldwide, and overseas visitors can't all buy. That likely explains part of the conversion rate dip.
| Traffic source | Sessions | Prior period | Change |
|---|---|---|---|
| Google search, no location | 924 | 443 | +109% |
| Google search, Singapore | 383 | 32 | +1,097% |
| Google search, Sydney | 240 | 51 | +371% |
| Google search, Chicago | 268 | 177 | +51% |
| Facebook (social) | 3,200 | 1,000 | +207% |
| Direct | 739 | 958 | −23% |
What Two Weekends Taught Us
Discover is reach
Sessions rose 63% while organic conversion rate fell 38.8%. Browsers outnumbered buyers.
Spikes last about a week
Each peak faded to near zero within 5 to 7 days. Plan for what stays, not the spike.
Broad topics win
Everyday coffee questions drew 87% of clicks. Niche camping and cleaning guides barely registered.
What the Data Shows
- 8,460 Discover clicks, with no ad spend behind them.
- Organic sessions rose 47.8%, but purchases fell 9.5%.
- Conversion rate fell 38.8% as the audience widened.
What It Means
- Blog content can win a lot of traffic at low cost.
- Traffic can jump sharply without revenue following.
- Judge blog content on what it moves, not on sessions alone.
How to Turn a Discover Spike Into Sales
Discover brings the reach. The work is building the path from content to product.
Step 01
Link posts to products
Send every storage and freshness post to the canister page, with a clear next step.
Step 02
Add CTAs above the fold
Discover readers skim. Put the product offer where they see it first.
Step 03
Repeat the winning format
Publish more broad, everyday coffee posts like the comparison and freshness guides.
Step 04
Track by page and country
Report Discover by landing page and referrer country so revenue can be attributed.
More Case Studies
$2.8M in Incremental Organic Revenue
Every account grew, measured against its own prior period.
Roofnest: +$182K Organic Revenue
Targeted collection pages and site structure.
Dr. Brandt: First 4 Months in the GEO Era
A new AI-referred revenue channel built from zero.
Want Content That Moves Revenue, Not Just Sessions?
Book a free audit and we'll show you where your organic and AI search visibility is leaving revenue on the table, with a scoped plan against your specific gaps.
Book Your Free Audit